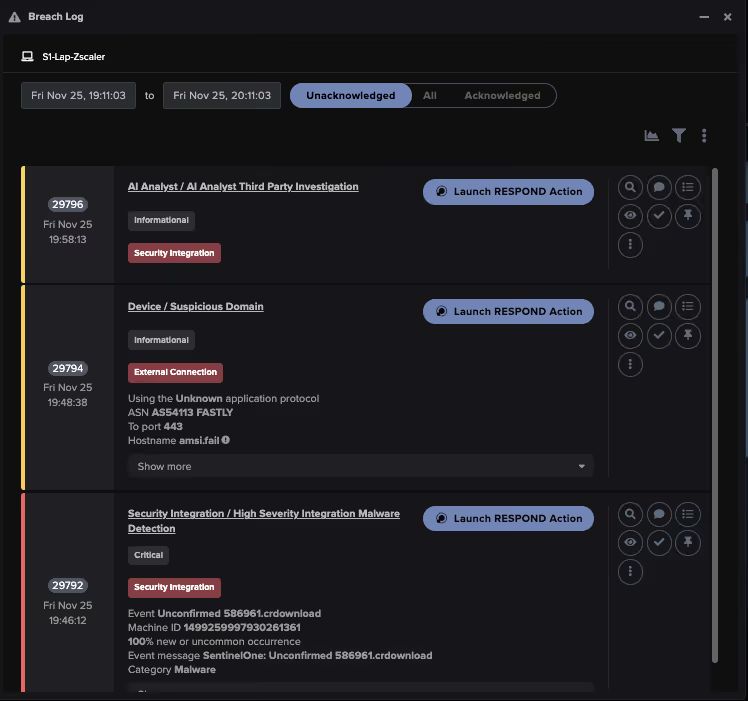
This blog demonstrates how we use EDR integration in Darktrace for detection & investigation. We’ll look at four key features, which are summarized with an example below:
1) Contextualizing existing Darktrace information – E.g. ‘There was a Microsoft Defender for Endpoint (MDE) alert 5 minutes after Darktrace saw the device beacon to an unusual destination on the internet. Let me pivot back into the Defender UI’
2) Cross-data detection engineering – ‘Darktrace, create an alert or trigger a response if you see a specific MDE alert and a native Darktrace detection on the same entity over a period of time’
3) Applying unsupervised machine learning to third-party EDR alerts – ‘Darktrace, create an alert or trigger a response if there is a specific MDE alert that is unusual for the entity, given the context’
4) Use third-party EDR alerts to trigger AI Analyst – ‘AI Analyst, this low-fidelity MDE alert flagged something on the endpoint. Please take a deep look at that device at the time of the Defender alert, conduct an investigation on Darktrace data and share your conclusions about whether there is more to it or not’
MDE is used as an example above, but Darktrace’s EDR integration capabilities extend beyond MDE to other EDRs as well, for example to Sentinel One and CrowdStrike EDR.
Darktrace brings its Self-Learning AI to your data, no matter where it resides. The data can be anywhere – in email environments, cloud, SaaS, OT, endpoints, or the network, for example. Usually, we want to get as close to the raw data as possible to get the maximum context for our machine learning.
We will explain how we leverage high-value integrations from our technology partners to bring further context to Darktrace, but also how we apply our Self-Learning AI to third-party data. While there are a broad range of integrations and capabilities available, we will primarily look at Microsoft Defender for Endpoint, CrowdStrike, and SentinelOne and focus on detection in this blog post.
The Nuts and Bolts – Setting up the Integration
Darktrace is an open platform – almost everything it does is API-driven. Our system and machine learning are flexible enough to ingest new types of data & combine it with already existing information.
The EDR integrations mentioned here are part of our 1-click integrations. All it requires is the right level of API access from the EDR solutions and the ability for Darktrace to communicate with the EDR’s API. This type of integration can be setup within minutes – it currently doesn’t require additional Darktrace licenses.
Figure 1: Set-up of Darktrace Graph Security API integration
As soon as the setup is complete, it enables various additional capabilities.
Let’s look at some of the key detection & investigation-focussed capabilities step-by-step.
Contextualizing Existing Darktrace Information
The most basic, but still highly-useful integration is enriching existing Darktrace information with EDR alerts. Darktrace shows a chronological history of associated telemetry and machine learning for each entity observed in the entities event log.
With an EDR integration enabled, we now start to see EDR alerts for the respective entities turn up in the entity’s event log at the correct point in time – with a ton of context and a 1-click pivot back to the native EDR console:
Figure 2: A pivot from the Darktrace Threat Visualizer to Microsoft Defender
This context is extremely useful to have in a single screen during investigations. Context is king – it reduces time-to-meaning and skill required to understand alerts.
Cross-Data Detection Engineering
When an EDR integration is activated, Darktrace enables an additional set of detections that leverage the new EDR alerts. This comes out of the box and doesn’t require any further detection engineering. It is worth mentioning though that the new EDR information is being made available in the background for bespoke detection engineering, if advanced users want to leverage these as custom metrics.
The trick here is that the added context provided by the additional EDR alerts allows for more refined detections – primarily to detect malicious activity with higher confidence. A network detection showing us beaconing over an unusual protocol or port combination to a rare destination on the internet is great – but seeing within Darktrace that CrowdStrike detected a potentially hostile file or process three minutes prior to the beaconing detection on the same device will greatly help to prioritize the detections and aid a subsequent investigation.
Here is an example of what this looks like in Darktrace:
Figure 3: A combined model breach in the Threat Visualizer
Applying Unsupervised Machine Learning to Third-Party EDR Alerts
Once we start seeing EDR alerts in Darktrace, we can start treating it like any other data – by applying unsupervised machine learning to it. This means we can then understand how unusual a given EDR detection is for each device in question. This is extremely powerful – it allows to reduce noisy alerts without requiring ongoing EDR alert tuning and opens a whole world of new detection capabilities.
As an example – let’s imagine a low-level malware alert keeps appearing from the EDR on a specific device. This might be a false-positive in the EDR, or just not of interest for the security team, but they may not have the resources or knowledge to further tune their EDR and get rid of this noisy alert.
While Darktrace keeps adding this as contextual information in the device’s event log, it could, depending on the context of the device, the EDR alert, and the overall environment, stop alerting on this particular EDR malware alert on this specific device if it stops being unusual. Over time, noise is reduced across the environment – but if that particular EDR alert appears on another device, or on the same device in a different context, it might get flagged again, as it now is unusual in the given context.
Darktrace then goes a step further, taking those unusual EDR alerts and combining them with unusual activity seen in other Darktrace coverage areas, like the network for example. Combining an unusual EDR alert with an unusual lateral movement attempt, for example, allows it to find these combined, high-precision, cross-data set anomalous events that are highly indicative of an active cyber-attack – without having to pre-define the exact nature of what ‘unusual’ looks like.

Figure 4: Combined EDR & network detection using unsupervised machine learning in Darktrace
Use Third-Party EDR Alerts to Trigger AI Analyst
Everything we discussed so far is great for improving precision in initial detections, adding context, and cutting through alert-noise. We don’t stop there though – we can also now use the third-party EDR alerts to trigger our investigation engine, the AI Analyst.
Cyber AI Analyst replicates and automates typical level 1 and level 2 Security Operations Centre (SOC) workflows. It is usually triggered by every native Darktrace detection. This is not a SOAR where playbooks are statically defined – AI Analyst builds hypotheses, gathers data, evaluates the data & reports on its findings based on the context of each individual scenario & investigation.
Darktrace can use EDR alerts as starting points for its investigation, with every EDR alert ingested now triggering AI Analyst. This is similar to giving a (low-level) EDR alert to a human analyst and telling them: ‘Go and take a look at information in Darktrace and try to conclude whether there is more to this EDR alert or not.’
The AI Analyst subsequently looks at the entity which had triggered the EDR alert and investigates all available Darktrace data on that entity, over a period of time, in light of that EDR alert. It does not pivot outside Darktrace itself for that investigation (e.g. back into the Microsoft console) but looks at all of the context natively available in Darktrace. If concludes that there is more to this EDR alert – e.g. a bigger incident – it will report on that and clearly flag it. The report can of course be directly downloaded as a PDF to be shared with other stakeholders.
This comes in handy for a variety of reasons – primarily to further automate security operations and alleviate pressure from human teams. AI Analyst’s investigative capabilities sit on top of everything we discussed so far (combining EDR detections with detections from other coverage areas, applying unsupervised machine learning to EDR detections, …).
However, it can also come in handy to follow up on low-severity EDR alerts for which you might not have the human resources to do so.
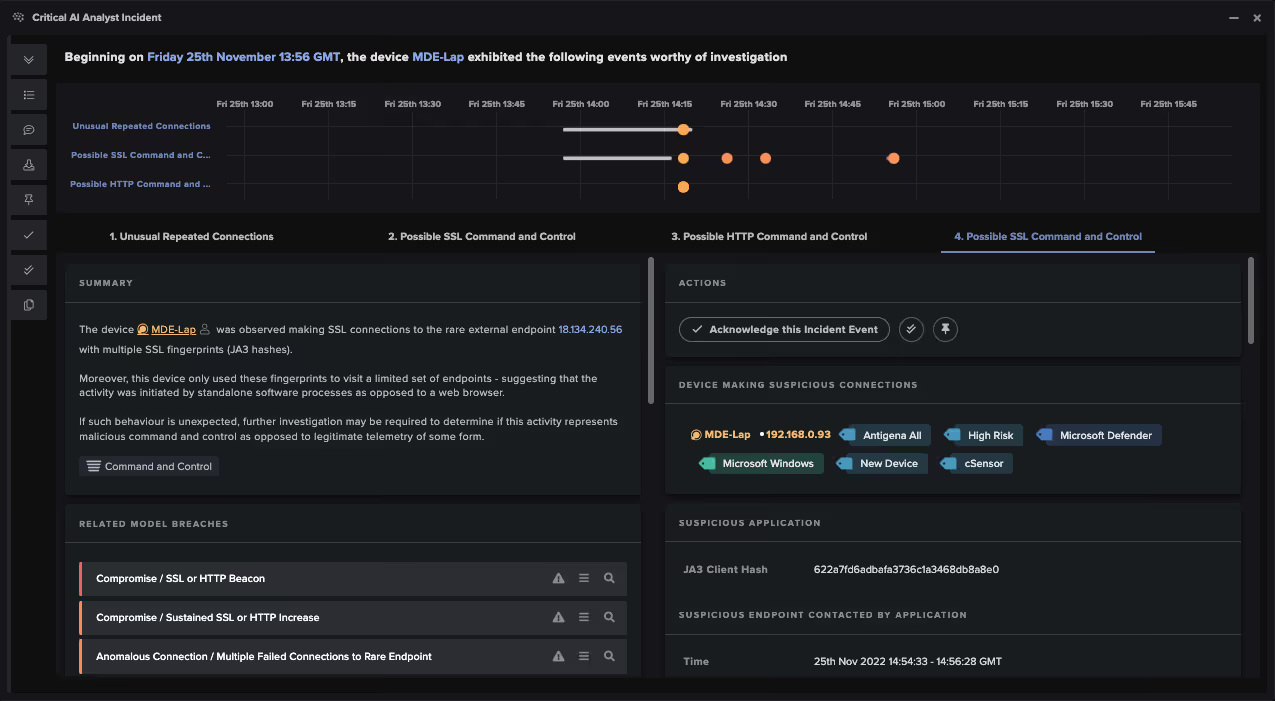
The below screenshot shows an example of a concluded AI Analyst investigation that was triggered by an EDR alert:

Figure 5: An AI Analyst incident trained on third-party data
The Impact of EDR Integrations
The purpose behind all of this is to augment human teams, save them time and drive further security automation.
By ingesting third-party endpoint alerts, combining it with our existing intelligence and applying unsupervised machine learning to it, we achieve that further security automation.
Analysts don’t have to switch between consoles for investigations. They can leverage our high-fidelity detections that look for unusual endpoint alerts, in combination with our already powerful detections across cloud and email systems, zero trust architecture, IT and OT networks, and more.
In our experience, this pinpoints the needle in the haystack – it cuts through noise and reduces the mean-time-to-detect and mean-time-to-investigate drastically.
All of this is done out of the box in Darktrace once the endpoint integrations are enabled. It does not need a data scientist to make the machine learning work. Nor does it need a detection engineer or threat hunter to create bespoke, meaningful detections. We want to reduce the barrier to entry for using detection and investigation solutions – in terms of skill and experience required. The system is still flexible, transparent, and open, meaning that advanced users can create their own combined detections, leveraging unsupervised machine learning across different data sets with a few clicks.
There are of course more endpoint integration capabilities available than what we covered here, and we will explore these in future blog posts.


![WHOIS Look records of the C2 endpoint vhs[.]delrosal[.]net.](https://cdn.prod.website-files.com/626ff4d25aca2edf4325ff97/69e6bd15391fbfb9bc810102_Screenshot%202026-04-20%20at%204.56.01%E2%80%AFPM.png)
![Earliest observed transaction record for blackice[.]sol on public ledgers.](https://cdn.prod.website-files.com/626ff4d25aca2edf4325ff97/69e6bd3a9035e7b16c8df83c_Screenshot%202026-04-20%20at%204.56.40%E2%80%AFPM.png)