Darktrace cyber analysts are world-class experts in threat intelligence, threat hunting and incident response, and provide 24/7 SOC support to thousands of Darktrace customers around the globe. Inside the SOC is exclusively authored by these experts, providing analysis of cyber incidents and threat trends, based on real-world experience in the field.
Written by
Jeffrey Macre
Principal Industrial Security Solutions Architect
Share
11
Sep 2023
At a glance:
Darktrace/OT leverages machine learning to provide actionable preventative analytics, relevant real time anomaly based threat detection, and a variety of response capabilities as a full suite protection for OT/ICS operations Purdue levels 5-0.
Self-Learning AI detects and responds to cyber threats including malicious or non malicious insiders and supply chain attacks.
Darktrace/OT deploys passively within NERC CIP environments providing visibility without the need for any external connectivity or threat intelligence updates.
What is FERC?
The US Federal Energy Regulatory Commission (FERC) is responsible for the regulation of the wholesale electricity and natural gas transmission. FERC sits above the North American Electric Reliability Corporation (NERC) which is responsible for the development and enforcement of reliability standards for the US bulk power system. NERC CIP reliability standards are standards enforced by NERC to ensure the safety and protection of the bulk electric system.
What is FERC order 887?
In review of the CIP requirements, FERC identified a security gap. The gap was that there is no requirement for internal network security monitoring (INSM) within the security perimeters of CIP networked systems. Without this requirement and protections in place, if an attacker was to breach the security perimeter of the CIP networked environment, the victim organization would have no capability of detecting and alerting to what the adversary is doing within the security perimeter.
FERC Order 887 is a final rule issued intended to direct NERC to develop new or modified reliability standards requiring internal network security monitoring INSM within Critical Infrastructure Protection (CIP) networked environments. A focus is placed on anomaly based detection used within the security perimeter so that threats without known rules and signatures associated, including insider threat and supply chain attacks, can be detected based on anomalous network activity within the CIP networked environment.
FERC order 887 specifically focuses on the need for addressing the INSM gap for BES high impact power generation systems with CIP networked environments with and without external connectivity and medium impact systems with external connectivity.
FERC Order 887 Requirements
1. Any new or modified CIP Reliability Standards should address the need for responsible entities to develop baselines of their network traffic inside their CIP-networked environment for BES Medium impact with external routable network connectivity and high impact with or without external routable network connectivity.
2. Any new or modified CIP Reliability Standards should address the need for responsible entities to monitor for and detect unauthorized activity, connections, devices, and software inside the CIP-networked environment. This should be done so that sophisticated threats including those that may already have persistent access to CIP networked systems, insider threats and supply chain threats can be detected at earlier stages.
3. Any new or modified CIP Reliability Standards should require responsible entities to identify anomalous activity to a high level of confidence by: (1) logging network traffic (we note that packet capture is one means of accomplishing this goal); (2) maintaining logs and other data collected regarding network traffic.
How does Darktrace support FERC order 887?
For security professionals to satisfy FERC order 887, it is ideal to deploy an INSM that leverages anomaly based detection and is capable of detecting insider threats and supply chain attacks within CIP networked environments in medium and high impact power generation sites. Additionally, the INSM has to be able to function within high impact sites without any external network connectivity.
Darktrace/OT leverages machine learning to provide actionable preventative analytics, relevant real time anomaly based threat detection, and a variety of response capabilities as a full suite protection for OT/ICS operations Purdue levels 5-0, helping security professionals accommodate for FERC order 887 requirements.
Darktrace establishes baseline and normal network activity via passive traffic analysis when monitoring the CIP-networked OT system. The baseline or “pattern of life” is then used to detect anomalies within the environment including unauthorized activity, connections, devices, and software inside the CIP-networked environment via anomaly-based detection.
Darktrace’s AI technology uses unsupervised machine learning to identify anomalous activity to a high statistical level of confidence by logging network traffic via packet capture and maintaining logs and other data collected regarding network traffic inherently within the platform for 1 year.
All log data stored by Darktrace can be exported to other systems so that it can be stored longer than 1 year. If you need to retain logs for more than 1 year, Darktrace can offload the logs to retain indefinitely.
Figure 1: AI Analyst Incident reporting an unusual reprogram command using the MODBUS protocol. The incident includes a plain English summary, relevant technical information, and the investigation process used by the AI.
Self-Learning AI
Darktrace/OT analyzes network traffic passively and learns the normal pattern of life of the these assets and their details (make, model, firmware, protocols, etc.). Darktrace/OT does not need any data or threat feeds from external sources because the AI builds an innate understanding of self without third-party support.
Darktrace is capable of detecting sophisticated novel malware-based attacks as well as supply chain attacks, insider threats, and other attacks where the adversary has established foothold or persistent legitimized access to systems and cannot be detected by rules and signatures-based detection systems.
Darktrace/OT is an intelligent decision-making engine that uses its evolving understanding of your industrial organization to prompt targeted, non-disruptive action to contain emerging attacks, actively responding to security events occurring within the security perimeter autonomously or via human confirmation using TCP/resets or Darktrace can respond at security boundaries via various integrations with network security tools including firewalls and OT zero trust solutions.
Figure 2: The Darktrace Threat Visualizer allows security analysts and OT engineers to visualize and replay incidents in real time.
Deploys in Isolation Without External Connectivity
Darktrace/OT can deploy passively without the need for any external network connectivity into any low, medium, or high impact power generation facilities and maintain 100 percent integrity of the existing segmentation including fully air gapped environments.
Once Darktrace/OT is deployed, Darktrace immediately begins monitoring, learning, and analyzing the raw OT network traffic (east/west and north/south) within the CIP-networked environment creating a live data flow topology and baseline of network connectivity.
Because all data-processing and analytics are performed locally on the Darktrace appliance, there is no requirement for Darktrace to have a connection out to the internet. As a result, Darktrace/OT provides visibility and threat detection to air-gapped or highly segmented networks without jeopardizing their integrity. If a human or machine displays even the most nuanced forms of threatening behavior, the solution can illuminate this in real time.
Attack Case Study: Insider Threat
In the real-world example below, Darktrace/OT detected a subtle deviation from normal behavior when a reprogram command was sent by an engineering workstation to a PLC controlling a pump, an action an insider threat with legitimized access to OT systems would take to alter the physical process without any malware involved. In this instance, AI Analyst, Darktrace’s investigation tool that triages events to reveal the full security incident, detected the event as unusual based on multiple metrics including the source of the command, the destination device, the time of the activity, and the command itself.
As a result, AI Analyst created a complete security incident, with a natural language summary, the technical details of the activity, and an investigation process explaining how it came to its conclusion. By leveraging Explainable AI, a security team can quickly triage and escalate Darktrace incidents in real time before it becomes disruptive, and even when performed by a trusted insider.
Figure 3: AI Analyst Incident reporting an unusual reprogram command using the MODBUS protocol. The incident includes a plain English summary, relevant technical information, and the investigation process used by the AI.
Credit to Daniel Simonds and Oakley Cox for their contribution to this blog.
Darktrace cyber analysts are world-class experts in threat intelligence, threat hunting and incident response, and provide 24/7 SOC support to thousands of Darktrace customers around the globe. Inside the SOC is exclusively authored by these experts, providing analysis of cyber incidents and threat trends, based on real-world experience in the field.
The CIP-015 Countdown: What Utilities Should Be Doing Before October 2028
CIP-015 is pushing utilities beyond perimeter security toward continuous internal network visibility. This blog explores what the standard requires, why anomaly detection and evidence retention matter, and how utilities can build a defensible INSM capability before the October 2028 compliance deadline.
Understanding the Canadian Critical Cyber Systems Protection Act
The Canadian federal Government introduced Bill C-8 which would enact the Critical Cyber Systems Protection Act (CCSPA). The CCSPA will formalize baseline cybersecurity duties for operators in federally regulated critical sectors.
Cyber Assessment Framework v4.0 Raises the Bar: 6 Questions every security team should ask about their security posture
A practical guide to the key detection and response updates in CAF v4.0, including anomaly-based detection, machine-led threat hunting, and proactive security posture requirements.
Building Operational Resilience Across Mission-Critical Marine Services
Mission-Critical Marine Services
This marine organization supports offshore energy production, export infrastructure, and regional logistics, delivering critical services through its diverse fleet and a regional shorebase footprint. To power rapid mobilization and 24/7 operational readiness, the organization has embraced cloud adoption and digital transformation, reshaping how crews, contractors, and shore-based teams access services.
While technology modernization has enhanced operations, it has also introduced new security complexities.
From perimeter to identity: As access becomes more distributed, identity has become the primary security control, elevating the risk of credential compromise and privilege misuse.
From confidentiality to availability and resilience: As cloud platforms increasingly underpin fleet and operational systems, cyber incidents can disrupt services and safety.
From isolated tools to unified visibility: Because Information Technology (IT) and Operational Technology (OT) often intersect, and legacy systems coexist with modern cloud platforms, fragmented monitoring makes it harder to understand risk and respond decisively across domains.
“Our cybersecurity priorities expanded along with our business goals, placing availability and resilience at the forefront. The impact of a potential threat became an operational risk, which elevated cybersecurity from an IT issue to an operational safety and resilience enabler.” - Information and Communications Technology (ICT) Manager.
A Unified, AI-Driven Platform for IT and OT
To strengthen visibility, detection, and response across its highly distributed environment, the customer adopted the Darktrace ActiveAI Security Platform™ in 2022.
Darktrace’s contextual detection capability was a key driver. Unlike traditional tools that rely on known threat signatures, Darktrace’s Self-Learning AI learns “normal” behavior to identify emerging threats and correlate visibility across the customer's siloed on-premises and cloud domains.
Today, the customer relies on:
Darktrace / EMAIL™ to reduce phishing risk and minimize disruption from legacy mail controls and false positives
Darktrace / IDENTITY™ to support identity-centric security as cloud access expands across vessels and shore-based operations
Darktrace / NETWORK™ to strengthen oversight across the broader environment, including operational contexts where IT and OT intersect
Darktrace / CLOUD™ (Azure), added in 2024, to extend detection and response into Azure and support cloud transformation without treating cloud as a separate security silo
Darktrace / Incident Readiness & Recovery to strengthen incident readiness and recovery planning
Darktrace Managed Detection and Response Services to provide 24/7/365 monitoring and support
This combination supports a single operating model for the customer: security that can adapt as the environment changes while remaining practical for a lean team responsible for safeguarding both business operations and safety-critical services.
Extending cloud protection without complexity
As the customer accelerated cloud adoption, it expanded coverage in 2024 with Darktrace / CLOUD for Azure to bring cloud workloads under the same AI-driven visibility and response model – without adding operational burden. “This matters in hybrid environments because attacks rarely stay in one place,” explains the ICT Manager. “A compromised identity can trigger activity in the cloud, which can open pathways back into on-premises systems.”
In parallel, Darktrace / CLOUD’s posture management capabilities support governance and audit readiness by surfacing misconfigurations and exposure risks earlier, before they become incidents.
A Stronger, Faster, More Resilient Business
Since adopting Darktrace, the customer has strengthened cyber resilience while reducing operational burden on its small ICT team.
Darktrace continuously analyzes millions of individual events that can contribute to a wider incident. Within a single month, the solution autonomously investigated 88% of all potential threats, taking appropriate action within just 39.4 seconds on average.
Autonomous capabilities ensure threats are stopped and contained until the ICT team can investigate. In one standout instance, Darktrace autonomously blocked malicious links during a mass phishing/spam event before other controls flagged the threat. the ICT Manager later confirmed Microsoft reported the link as malicious, but Darktrace had already acted to prevent delivery and reduce exposure.
“Whether something happens during off hours, while we’re on vacation, or when our attention is focused elsewhere, we’re confident Darktrace will take control and stop a threat before it spreads,” says the ICT Manager.
Darktrace’s Self-Learning AI combines multiple AI methods and advanced techniques to improve threat detection, investigation, and response dramatically reducing alert overload and manual triage. Within a single month, the solution saved the customer's IT group 411 equivalent human investigation hours.
“For a lean team supporting a 24/7 operational footprint, this autonomous action eliminates the constant firefighting and stress, giving us the space to focus on higher-value priorities.”- Information and Communications Technology (ICT) Manager.
Protecting communications without disruption
the customer experienced friction from legacy email and network controls prior to Darktrace, which generated high false positive rates, disrupted legitimate communications, created operational drag, and added workload for ICT. With Darktrace / EMAIL learning normal email behavior and applying context-aware actions, the team reduced unnecessary interruptions while maintaining protection.
“That shift matters in marine services, where business communications directly support coordination across vessels, shore bases, clients, ports, and regulators,” says the ICT Manager. “Darktrace doesn’t just block more threats, it autonomously makes decisions that preserve operational continuity and enable my team to focus on credible threats instead of chasing volume.”
Delivering clarity and confidence
Darktrace has reduced manual triage by correlating activity across email, identity, network, and cloud, providing the context needed to prioritize what matters without requiring the ICT team to stitch together evidence across multiple tools.
“With unified visibility we can identify patterns across domains, make informed decisions about where risk actually exists, and align security actions with operational impact rather than theoretical threats,” explains the ICT Manager. “I can now prioritize effort and investment across our ICT landscape with far greater confidence.”
Regular Executive Threat Reports reinforce operational confidence by giving leadership clear visibility into threats Darktrace has handled autonomously, supporting decisive action when needed and confidence to avoid unnecessary disruption when it isn’t.
Scaling Securely in a Hybrid World
As the customer advances its cloud transformation, the ICT Manager sees the Darktrace partnership evolving into a foundational layer of resilience and assurance, supporting scale, governance, and operational confidence in an increasingly cloud-centric environment.
Key priorities include:
Shifting from hybrid visibility to cloud-first resilience, using continuous monitoring and posture insights to reduce exposure earlier
Strengthening governance and audit readiness, especially as critical workloads and sensitive data expand in Azure and expectations rise under regulatory and client assurance requirements
Increasing reliance on autonomous response and AI investigation as the number of identities, workloads, and access paths grows faster than headcount
Deepening cross-domain correlation so cloud signals further enrich decision-making, supporting faster containment and more confident prioritization
“As we accelerate our cloud strategy, Darktrace will play an even more strategic role,” says the ICT Manager, “providing the guidance, technology, and expertise that allow us to grow with confidence and innovate securely.”
Hiding in Plain Sight: Uncovering a Multi-Stage Ransomware Attack Through Behavioral Detection
Why ransomware has changed
Ransomware attacks have continued to increase globally, with 698 incidents reported in May 2026, representing a 48% rise compared to 472 incidents in May 2025 [1]. At the same time, the ransomware landscape is evolving. Several major ransomware groups, including LockBit [2], have been disrupted by successful joint law enforcement operations, resulting in a shift away from a small number of dominant actors towards a more fragmented and distributed ecosystem. This is increasingly composed of smaller groups who play a specialized role in the attack, such as initial access brokers, affiliates or developers.
As a result, ransomware tactics, techniques, and procedures (TTPs) are becoming more diverse and less predictable. On top of this, adversaries are leveraging native tools and legitimate penetration testing frameworks to evade detection. Anomaly-based detection is therefore critical to identify pre-ransomware activity, rather than relying on signatures associated with a handful of well-known ransomware groups.
As these attacks often unfold over several days, there is a critical window for defenders to act. In this context, behavioral-based detection plays a vital role in identifying suspicious pre-ransomware activity, and enabling early intervention before encryption or exfiltration occurs.
Inside a modern ransomware intrusion
In early 2026, Darktrace detected activity within a customer’s environment related to a multi-stage ransomware intrusion from the initial compromise. This activity does not appear to be attributable to a specific ransomware group, and no known ransomware payload was observed until the final stage.
The attack aligns with a broader industry trend in which compromised virtual private network (VPN) credentials are used as an entry point, followed by rapid internal reconnaissance and lateral movement using legitimate administrative tools. This growing preference for native tools and legitimate frameworks in cyber-attacks illustrates that it is increasingly unreliable to depend solely on traditional indicators of compromise such as known malware signatures or exploit detection.
The intrusion also involved the use of Sliver, an open-source adversary emulation framework, which is increasingly observed in real-world attacks. Originally designed for penetration testing and red teaming, Sliver has gained traction among threat actors as a stealthier alternative to more heavily signatured frameworks such as Cobalt Strike. As a legitimate framework, its use further complicates detection for security tools that rely on known malicious signatures.
Darktrace’s detection of a ransomware event in a customer’s environment
The initial compromise appears to have occurred via compromised credentials used over the VPN shortly before, or at the onset of the first indicators of suspicious activity. While it remains unclear as to how or when the threat actors gained access to these credentials, the use of initial access brokers (IABs) is a common feature of modern ransomware operations. This suggests that access to the environment may have been established several days or weeks beforehand.
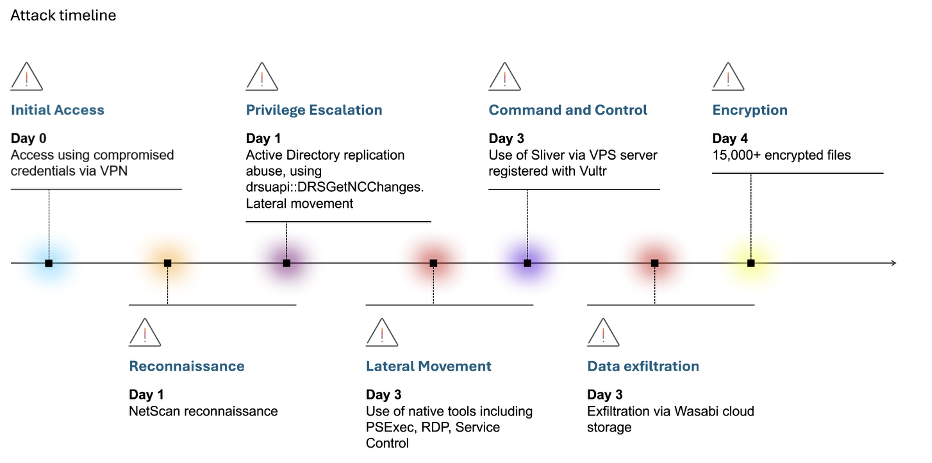
The intrusion unfolded over three days, presenting multiple opportunities for early detection and intervention before ransomware deployment. The attack progressed through a compressed but structured sequence: initial access and reconnaissance were completed within hours, followed by privilege escalation and lateral movement the next day, and culminating in data exfiltration and encryption shortly thereafter. Throughout each stage, distinct behavioral anomalies emerged across the network providing clear indicators of malicious activity well before the ransomware was deployed.
While Darktrace’s Autonomous Response capability was enabled within the customer’s environment, it was not fully configured across the impacted devices, allowing the attack to progress to ransomware deployment. Had Autonomous Response been fully deployed across the affected systems, it could have taken targeted action against the earliest stages of malicious activity, potentially disrupting the intrusion before it escalated.
Figure 1: Timeline of the attack progression.
Day 1: Reconnaissance and privilege escalation
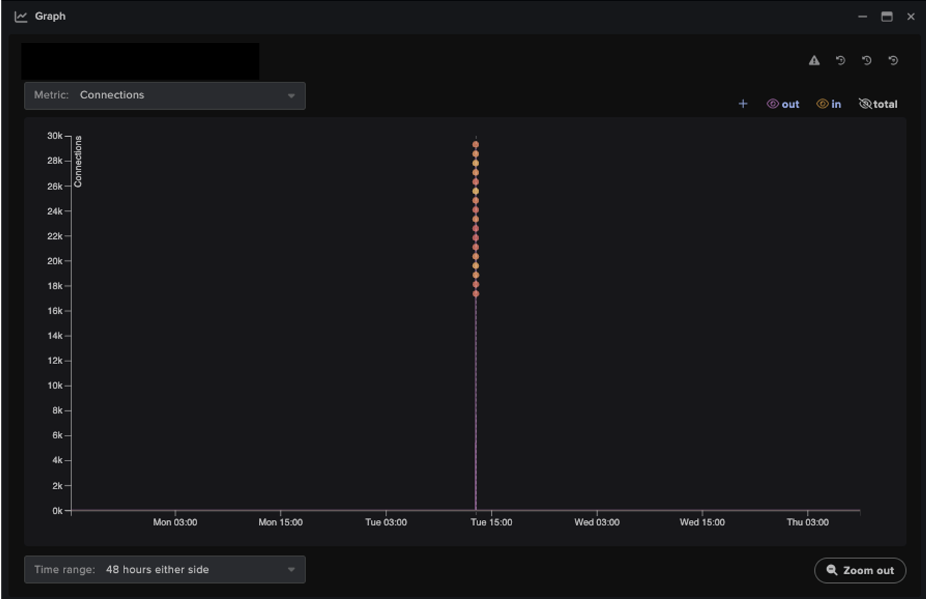
The threat actor gained access via compromised VPN credentials and initiated internal reconnaissance. Darktrace detected anomalous scanning behavior, including unusual port scanning activity and widespread network enumeration.
Specifically, Darktrace detected a high volume of east-west scanning activity across a broad range of ports, with TCP connections targeting ports 21, 80, 445, 4899 and 8080. Associated URIs suggested the use of Nmap, a widely used penetration testing tool. This highlights how attackers often leverage legitimate penetration testing tools for malicious reconnaissance, enabling them to blend into normal network activity and evade traditional signature-based detection methods.
Figure 2: Darktrace's detection of a sharp increase in anomalous internal connections, triggering multiple high-severity model alerts associated with reconnaissance activity.
Several devices were observed using administrative credentials to carry out privileged actions in a manner that was highly anomalous for the environment. This activity was accompanied by behavior consistent with SMB authentication scanning, suggesting efforts to identify and access additional systems. As the activity intensified, an increasing number of devices became involved, signalling lateral movement and further spread across the network.
Darktrace also identified privilege escalation through active directory (AD) replication abuse, specifically via the drsuapi::DRSGetNCChanges function. This technique allows an attacker with sufficient privileges to request directory replication data from a domain controller (DC), enabling them to extract credentials, including password hashes, without directly interacting with user accounts. Commonly associated with ‘DCSync’ attacks, this technique is frequently used to obtain highly privileged credentials and enable further escalation within an environment.
Figure 3: Darktrace’s detection of anomalous AD replication activity indicative of privilege escalation.
This activity was seen alongside the use of the now obsolete SMBv1, repeated NTLM authentication attempts using multiple variations of ‘Administrator’ credentials, reverse DNS scanning, and large-scale network scanning. Darktrace observed widespread use of SMBv1 across the customer’s environment, exposing a significant security weakness. As a legacy protocol with well-documented weaknesses, SMBv1 can be exploited to facilitate lateral movement, allowing the attackers to expand their access following initial compromise.
Day 3: Lateral Movement, Command & Control, and Exfiltration
Two days later, the attacker escalated privileges and expanded their foothold using living-off-the-land (LOTL) techniques such as PSExec, WMI, and RDP. Concurrently, Darktrace identified command-and-control (C2)-style communications consistent with the Sliver framework, alongside rare outbound connections to cloud infrastructure indicating potential data exfiltration. The volume and severity of observed activity increased as attack behavior intensified.
The device was observed conducting extensive lateral movement, leveraging LOTL techniques to evade detection. Activity included WMI execution (e.g. ExecQuery), DCE-RPC activity, SMB sessions and file writes, most of which were successful, as well as the deployment of PSEXESVC.exe via ADMIN$ shares and prolonged RDP sessions. Darktrace identified this behavior as highly anomalous for the environment. Such activity is commonly associated with the transfer of attacker tooling, remote command execution, and the establishment of persistent access across compromised systems.
Figure 4: Darktrace’s detection of a spike in RPC binding events indicative of potential lateral movement.
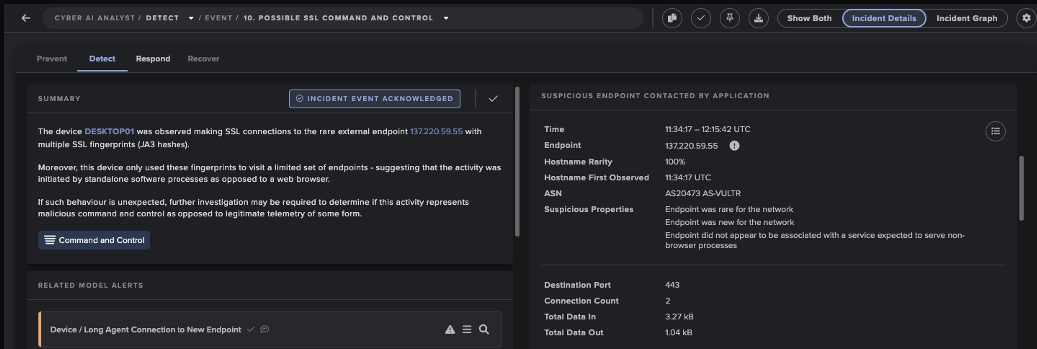
On the same day, Darktrace detected C2-style SSL communications originating from multiple internal devices to rare external endpoints. These connections exhibited anomalous characteristics, including invalid SSL certificates and repeated connection patterns resembling beaconing. Analysis of the observed JA3 fingerprint further linked the activity to Sliver, the adversary simulation framework referenced earlier, as the hash has previously been associated with Sliver-related infrastructure [3]. The use of this framework reflects a broader trend of attackers repurposing legitimate offensive security tools for stealthy C2 communications. Connections to 137[.]220[.]59[.]55 (ASN AS20473 AS-VULTR) indicated that the communications were likely routed via a virtual private server (VPS) hosted by Vultr. Attackers often utilize VPS infrastructure from legitimate cloud providers like Vultr to obscure their true origin, blend into benign traffic, and evade IP-based detection mechanisms [4].
Figure 5: Darktrace’s Cyber AI Analyst detection of two linked unusual connections to Vultr infrastructure.
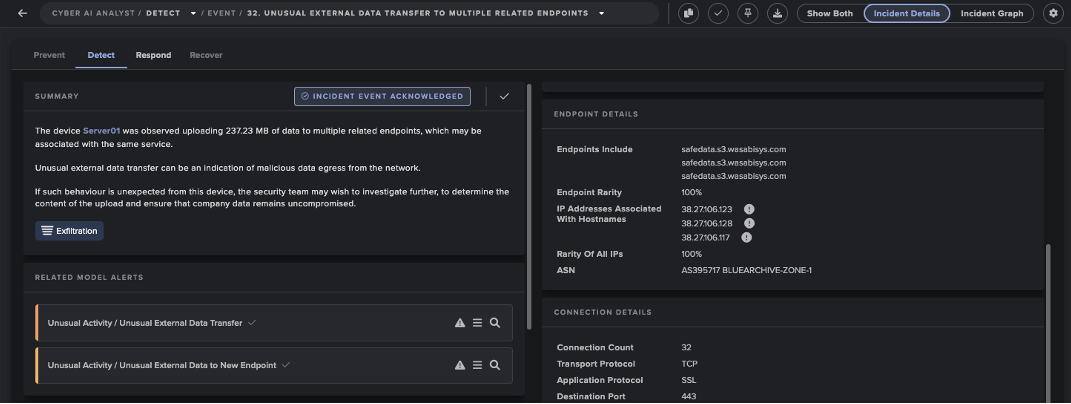
Darktrace also observed a device initiating SSL connections to safedata.s3[.]wasabisys[.]com, an endpoint associated with Wasabi cloud storage. Darktrace recognized that neither the destination nor the associated IP address had previously been observed within the environment. More than 200 MB of data was subsequently uploaded externally to endpoints sharing the same JA3 client hash, indicating a sustained transfer session and potential data exfiltration to third-party storage. The apparent exfiltration prior to encryption is consistent with a double-extortion ransomware strategy.
Figure 6: Darktrace’s Cyber AI Analyst detection of more than 30 rare outbound connections to a Wasabi cloud storage endpoint, indicative of potential data exfiltration
Day 4: Encryption
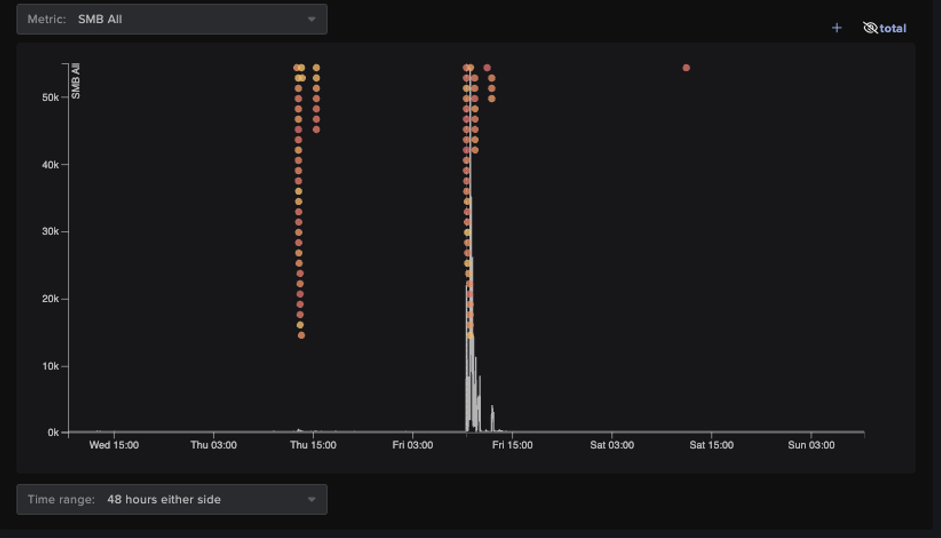
The attack culminated in ransomware deployment, marking the transition from suspicious network activity to a business-impacting incident. Using SMB-based propagation, the threat actor encrypted thousands of files across the network, affecting multiple systems and disrupting normal operations. Throughout the encryption event, the legacy SMBv1 protocol was used extensively across multiple internal systems, resulting in a significant increase in newly encrypted files.
Figure 7: Darktrace’s detection of abnormal spikes in SMB activity and associated model alerts, indicative of ransomware encryption and propagation.
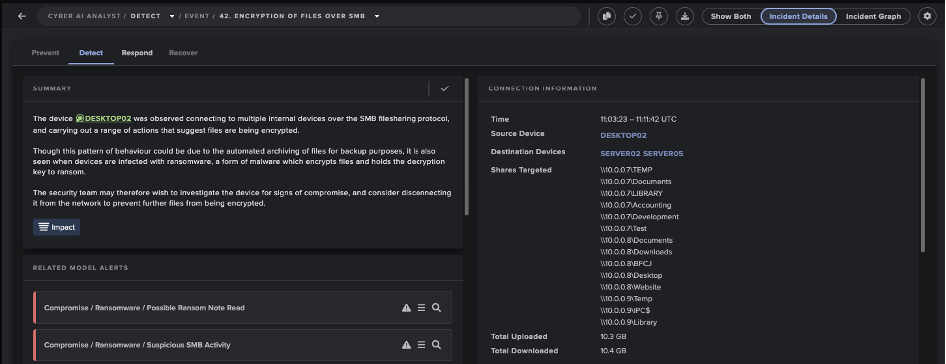
Darktrace’s Cyber AI Analyst automatically investigated and correlated the encryption activity and related events into a single incident narrative, providing the customer with real-time visibility into the attack while significantly reducing investigation time.
Figure 8: Darktrace’s Cyber AI Analyst’s investigation into the encryption activity. AI Analyst incident detailing example encryption activity in real time. Related events are automatically correlated and summarized into a clear narrative, reducing investigation time.
Defender action recommendations
What Could Have Stopped the Attack Earlier?
Although the attack ultimately resulted in ransomware deployment, there were multiple opportunities to detect, contain, and disrupt the intrusion before encryption occurred. The following actions could have significantly reduced the overall impact:
Detect and investigate indicators of reconnaissance and lateral movement
Unusual scanning
Active Directory replication anomalies consistent with DCSync activity
Anomalous use of native tools and processes indicative of LOTL attacks
Unusual use of common reconnaissance tools such as Nmap and NetScan
Contain compromised credentials and affected devices
Disable and reset compromised VPN credentials
Isolate devices performing anomalous scanning and lateral movement activity
Block suspicious external communications and data exfiltration
Use anomaly-based detection to detect and block repeated outbound connections to rare external infrastructure
Prevent data exfiltration to unauthorized cloud storage services such as Wasabi
Conclusion
The incident highlights the importance of anomaly-based detection, particularly against attacks that primarily use native or legitimate tools to evade traditional security measures. Darktrace identified suspicious activity from the first day of the compromise, providing multiple opportunities to disrupt the intrusion before it progressed to lateral movement and data exfiltration.
In this instance, detection was not the limiting factor; response time was. Prompt investigation and containment of devices exhibiting anomalous behavior could have prevented lateral movement, data exfiltration, and ultimately ransomware deployment.
As adversaries increasingly prioritize stealth over custom malware, relying instead on legitimate tools, valid credentials, and trusted infrastructure, traditional signature-based detection becomes less effective. Identifying subtle behavioral deviations early remains critical to disrupting attacks before they escalate into full-scale ransomware incidents.
Credit to Alexandra Evzona (Cyber Analyst), Priya Thapa (Senior Cyber Analyst) Edited by Ryan Traill (Content Manager)


%201.avif)
.jpg)